Control systems and automation
ary of ‘normal operation’ shown in Figure 1 will cause premature
alarming of an approach to the boundary and possibly so premature
that the operator will ignore the request for intervention. False alarms
bring the whole alarm system into disrepute. They are measurable,
although very few have attempted to measure them, and are predict-
able using our method against the objectives of ‘normal operation’.
Zero unalarmed events – predictable only for known abnormal
events that occurred in the past. One can never be sure that unimag-
ined or unimaginable events would be alarmed. This exposure can
only be addressed by assiduously recording and investigating every
unalarmed event that occurs so is best done by the unit process en-
gineer within the ‘process stewardship’ application. The solution may
involve the addition of new alarms following a HAZOP.
A high rather than low proportion of alarmed variables annunciat-
ing during a long time period - this is both measurable and predict-
able. This follows from observing in Figure 1 that alarm limits placed
outside the boundary of normal operation in the orange ‘recovery’
space will at best annunciate late and if placed too far out may never
annunciate at all. Using alarm performance as the only target leads, in
practice, to many alarms being disabled through being pushed too far
into the orange zone. The boundary of normal operation corresponds
to the envelope of the operating objectives of the plant projected
onto all variables. It used to be that there was no way to locate this
boundary so that alarms were
scattered in its general vicin-
ity as shown schematically in
Figure 1.
Figure 1: Operator alarm limits
as they usually are when the
boundary of normal operation is
unknown.
Some alarm limits are set in the
orange recovery space where
they will, at best, annunciate late, giving the process disturbance
more time to grow and requiring a larger corrective action, or in
many cases are set so wide that they can never annunciate. Other
alarm limits are set inside the green ‘normal operation’ space where
they will annunciate unnecessarily some of the time creating false
alarms and leading to their being labelled as ‘bad actors’. Without
knowledge of the location of boundary or of how alarms relate to
each other there is little that can be done to cure a bad actor other
than to push the alarm limit ‘outwards’ towards or past the guessed
position of the boundary.
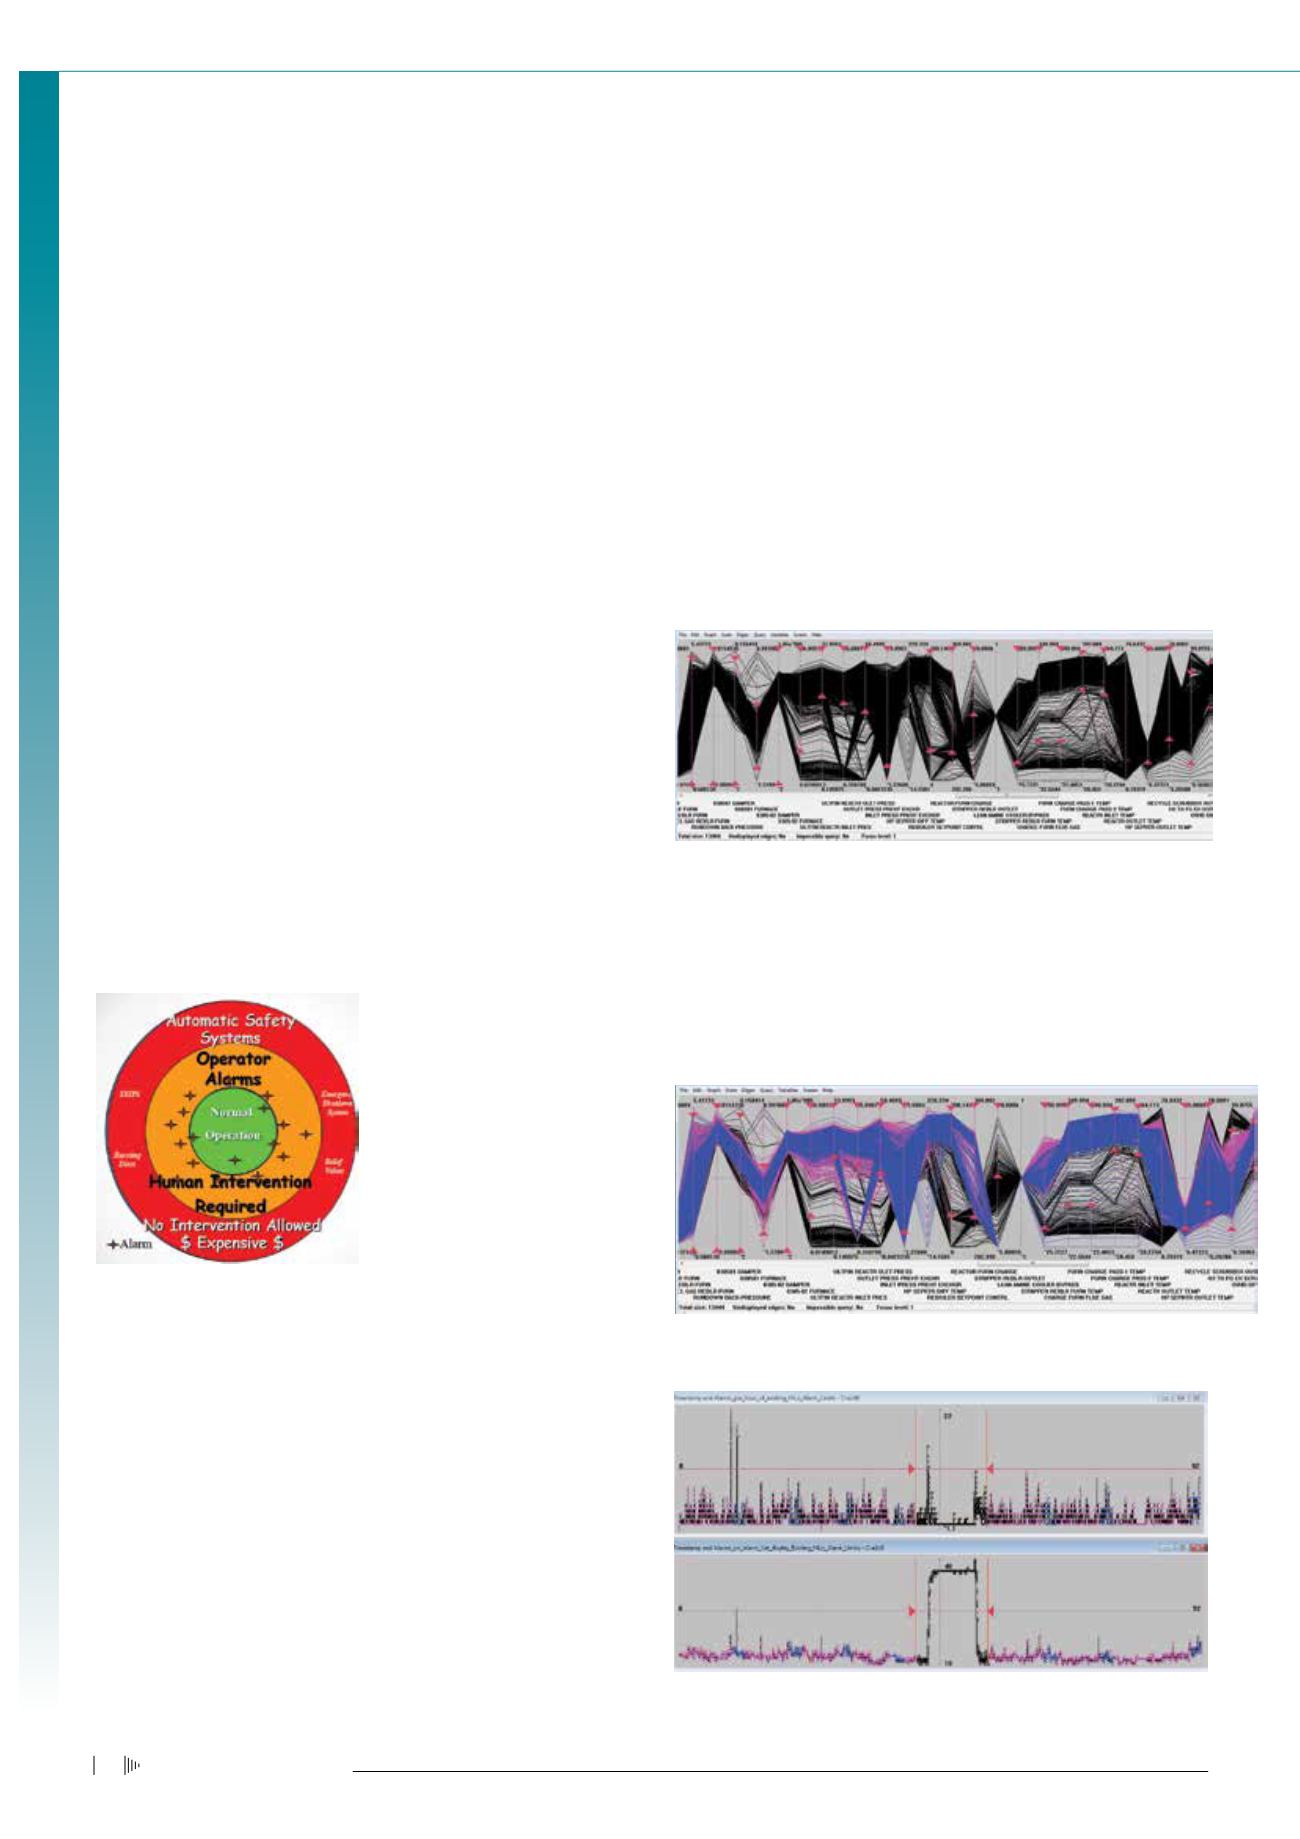
An observation in [1]showed that the concept that was missing
was that of a multi-dimensional ‘operating envelope’ of a process
and introduced the parallel coordinate graph as a novel method of
viewing envelopes and the boundary of normal operation for many
hundreds of variables at the same time. Super-imposing the exist-
ing alarm limits as red triangles on the parallel co-ordinate graph
containing three months of process data at 10-minute intervals as in
Figure 2 it is immediately apparent that this is not a good set of alarm
limits. Some are inside the solid black area so will give false alarms
at least some of the time; others are so far outside the black area that
they will, at best, annunciate late in the event of an excursion out of
past operating experience and may never annunciate at all. This is
confirmed in Figure 4 which shows ‘annunciations per hour’ and the
‘number of alarms’ visible on the operator’s alarm display throughout
the whole three months of operation covered by the data.
Figure 2: Existing HiLo alarm limits superimposed upon three months of
operating data.
The Envelope of all operation in Figure 2 encloses other Envelopes
with more specific objectives such as the ‘kerosene operating mode
envelope ’, the ‘LGO mode operating envelope’ and the ‘stand-by
mode operating envelope’. These are shown in Figure 3 in pink, blue
and black respectively.
Figure 3: The ‘all-operation envelope’ separated into its sub-envelopes of
‘kerosene mode’ in pink, LGO mode in blue and standby mode in black.
Figure 4: Existing alarm performance annunciations per hour (top) and alarm
count (bottom) versus time for three months of operation.
Electricity+Control
December ‘13
6


