Shesby Chabaya, head of operations for WearCheck in Zimbabwe, investigates the reasons behind an organisation’s inability to achieve cost savings from oil analysis and how to optimise their operational cost savings by responding promptly to the outcomes of oil analysis reports.
Click to download and read pdf
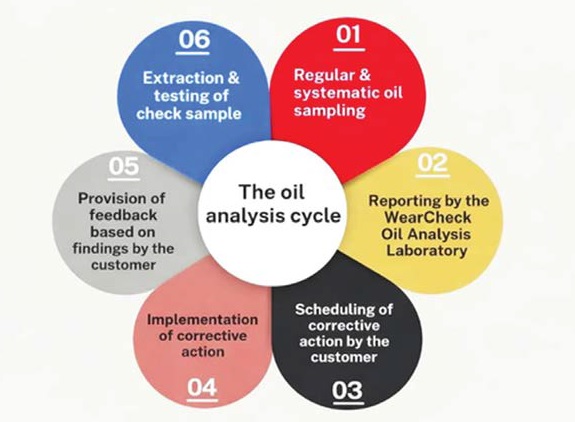
The Oil Analysis Cycle begins with regular, systematic oil sampling that generates data to support informed decision-making.
Many organisations conducting oil analysis face the challenge of maximising operational cost savings while under pressure to achieve full production and enhance shareholder value. Oil analysis provides a means to achieve the end goal – a positive payback and overall cost savings. However, this is not a given. An organisation may or may not achieve the intended benefits for several reasons, chief among them the failure to implement a sound corrective action strategy.
The oil-analysis cycle
To achieve financial savings, organisations must implement an effective oil analysis programme and conduct periodic audits to ensure processes are followed. This begins with regular, systematic oil sampling to generate data that support informed decision-making. The oil analysis or cost-savings cycle is iterative and can be detailed as shown in Figure 1:
When oil sampling is done on a regular and systematic basis, problems are identified and reported by the laboratory, equipment is scheduled for troubleshooting and investigation, and corrective action addressing the root cause is implemented, guided by the laboratory's response time. This results in performance improvements and cost savings. A check sample is taken to confirm improvement, and the process keeps repeating as machine operating hours increase.
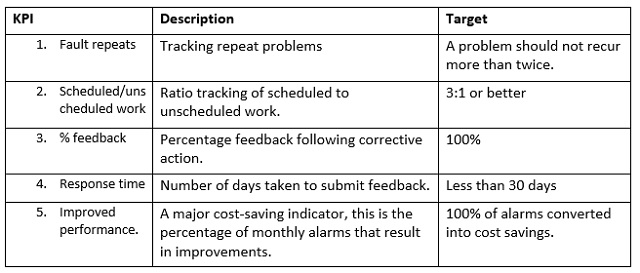
Often, corrective action is taken, but the problem persists. The key is in addressing the root cause of the identified problem. The KPIs below can be utilised to track the effectiveness of corrective action taken or the lack thereof:
 The Big Picture Principle
It is not enough to focus solely on reacting to individual oil sample results, even though this contributes immensely to overall cost savings. The big-picture principle must be applied on an ongoing basis, with the maintenance engineer or manager taking a strategic approach. This entails examining the overall context; trending results month by month and year by year; and looking at long-term outcomes and indicators; prioritising critical issues; and focusing on solutions to identify fleet or plant problems, adaptability and sustainability.
Some of the key questions are:
- Is this problem affecting this component only or the entire fleet or plant?
- Is it affecting a specific make & model of plant equipment?
- Is it affecting how a plant operates in a specific operating environment?
- Is it affected by changes in load or intensity of operation?
- Is it affecting equipment operated by a specific operator?
- Are all operational systems adaptable and responsive to current needs or indicators?
WearCheck can assist customers in managing and optimising their oil analysis programmes through comprehensive KPI reports that distil key data such as severity trends, repeat problems, component or fleet-level problem patterns and data-quality issues into clear, actionable insights that assist with reliability improvement and root cause analysis. These tailored reports form part of WearCheck’s management-support offering and are available as an optional service upon request.
What cost savings are NOT!
In a recent study, we examined a year’s worth of oil analysis data from all components of a mobile plant for a manufacturing company. This included engines, transmissions, hydraulic systems and axles. The findings were as follows:
- 46% of the annual oil samples extracted triggered alarms (Ratio almost 1:2).
- 28% of the total annual problems or alarms were repeat issues.
- 1 in every 3 alarms represented a repeat problem.
One in every two oil sample results is an alarm, and the total number of alarms was 27% above the target set for the year. The percentage of repeat problems is significant, indicating that it is the key driver of accumulated annual alarms/overall problematic oil samples. These statistics are unacceptable, and the programme can be described as uneconomical.
A recurring problem is a pointer to a slow response to alarms, or to the fact that the corrective action implemented did not address the root cause. Alternatively, it simply indicates the absence of corrective action. We decided to test this assertion further by examining the level of feedback, and the findings were as follows:
- The annual percentage of samples that resulted in feedback was 28%.
- The average number of days for feedback to be submitted following an analysis was 186 days, and in some cases, following reports requiring feedback, there were over 300 days without a response.
This clearly indicates a poor responsiveness to the alarms highlighted by oil analysis.
Given these findings, it is apparent that a large percentage of alarms went unresolved, resulting in fault repeats and potential cost savings lost. Identified problems continued to recur, exposing the fleet to the risk of catastrophic failure and negatively impacting productivity.
Sound corrective action at the heart
Just as a snowball rolling down a slope will pick up more snow along the way and grow larger, a regular study of oil analysis data over two decades has revealed that small, identified problems, if not resolved early, will grow into much larger and more complex challenges over time. The identified problem keeps recurring and worsening, often leading to component failure.
The longer one waits or procrastinates before addressing a problem, the higher the likelihood that it will not be addressed, exposing the plant to the risk of component failure, expensive repairs and lost production.
In a subsequent study, we examined whether there was a correlation among low feedback levels, fault repeats, component failures, component changes, and other factors. We discovered a direct link between changes in oil-wetted components and repeated faults in oil analysis. The components being repaired had a history of repeated contamination and wear issues.
There was also a common pattern observed with the third consecutive fault occurrences. In areas of high operational intensity, three out of four components with fault repeats either underwent a part change on the third occurrence or a complete component change.
In areas of low operational intensity, repeated part changes were common. Table 1 highlights this trend, showing the history from normal to severe status for a Fleet D01 Transmission component. Borderline status in month three led to further deterioration in months four and five, with resultant component failure three months after the water-contamination problem was first discovered.
This aligns with this key principle: ‘Oil analysis helps the most if you pick up a problem and address it at its onset’.
We also noticed that this phenomenon of excessive fault repeats was associated with over-expenditure. ‘We have overshot our budget’ was a common refrain during feedback sessions. Components end up running to failure, reminiscent of the Black Swan Effect, where unpredictable events are explained in hindsight, but with severe consequences that often affect an entire production line.
New equipment purchase costs were found to exceed US$ 500,000 and, in some cases, running above US$ 1 million, depending on machine type, brand, size, application and other factors. We realised that by year five, substantial component changes that increased the average cost of equipment ownership meant the equipment was still unable to reach its full expected life.
The above scenario provides a compelling case for every organisation that has decided to embark on an oil analysis programme to put in place and relentlessly enforce systems that enhance effectiveness and efficiency, guided by the vision to achieve cost savings.
Every alarm presents an opportunity to save. It therefore follows that if an organisation is to reap the benefits of investing in an oil analysis programme, a sound corrective-action strategy must be at the heart of the maintenance system
What cost savings are: a forklift differential case study
To demonstrate what cost savings are available, we examined a case study from Delta Transport Services, the Transport and Logistics arm of Delta Corporation Limited, a leading beverage-manufacturing company in Southern Africa that has been implementing the oil analysis programme for the past twenty-five years:
A scheduled oil sample was extracted from a forklift differential. The WearCheck laboratory detected and urgently reported critical water contamination at 4.1%. The workshop responded quickly by replacing the defective breather. The results of the two subsequent oil tests showed that the issue had vanished, indicating that the problem’s underlying cause had been identified and fixed. The history tracking report illustrates this improvement.
If the issue hadn’t been resolved promptly, the organisation might have suffered a premature differential failure, costing it anywhere from US$2 500 to US$9 000 in repairs or component replacement expenses, not to mention the cost of lost productivity and downtime.
If this had been a CAT 797 mining dump truck, this same solution could have saved US$100 000 on a differential overhaul. The team's good responsiveness significantly reduced the risk of failure, thereby improving forklift availability and reliability. This approach has been utilised across the entire fleet at Delta Transport Services, resulting in significant cost savings and enabling Delta’s forklifts to operate for 18-21 operational hours per day.
Delta Transport Services Technical Manager, Mr Tavonga Gwatidzo, had this to say: “Well done to the team for upholding systems and maintaining a good level of responsiveness to the alerts by WearCheck. The WearCheck tribology programme has assisted Delta Transport to maintain a reliable, healthy and highly productive fleet. We have achieved up to 30 000 forklift operational hours, exceeding the target of 18 000 hours. We believe that the effective implementation of the oil analysis and condition monitoring programme is contributing significantly to this level of success. Thank you to Team WearCheck for the partnership.”
Kennedy Kashangura, Delta Transport Services National Operations Executive, added: “Our two key KPIs – oil sampling compliance and corrective action response rate – help us to maximise operational cost savings and keep productivity high. With an average fleet availability of 98.8%, we can deliver our products on time, ensuring high customer satisfaction. Our systems are standardised throughout all our operations around the country, with WearCheck at the heart of our maintenance systems.”
In reality, time, resources and production pressure are always constraints. From WearCheck’s perspective, feedback is critical. To ensure full team participation in the continuous improvement process and boost cost savings, we encourage the implementation of a four-pronged actions-and-feedback approach as follows:
- This is what I found as the root cause of the problem.
- This is what I did to address the root cause of the problem.
- These are the further challenges or risks I have observed.
- Given more time, this is what I would do.
Gaining maximum return on investment from a good condition monitoring programme requires leadership with a strong business culture, the cultivation of a positive work ethic and a winning mentality across the team, and, ultimately, cost savings.
Oil analysis is not an event; it is a process involving the accumulation of many tiny actions that can result in a Domino Effect – where one event triggers a chain of related events. Small, consistent corrective actions in oil analysis will lead to significant outcomes, including substantial cost savings and full asset utilisation.
These wins are evident in individual improvements that accumulate over time.