22
Chemical Technology • September 2013
The tubes were open capped (agarose surface having
access to air) and incubated in the dark at 20°C for 7
days (Figure 3).
After incubation had been completed, tubes were
swabbed with ethanol, etched with a diamond glass
cutter and then broken cleanly at the bottom. The
agarose plug was then extruded onto an aseptic sur-
face in a laminar flow hood. The plug was sliced into
5 mm lengths and each sample placed into a separate
sterile Eppendorf tube that contained 1 ml sterile Tris-
EDTA buffer (0,01 M Tris, 0,05M EDTA). Samples were
heated to 50°C, vortexed, and (with the exception of
those to be used in sulphide analyses) were stored at
4°C overnight to facilitate diffusion. They were then
analysed to measure the levels of sulphate, sulphur
and total organic carbon (TOC). Samples for molecular
phylogenetic analysis (results not reported here) were
obtained prior to the heating step.
For the sulphide analysis, 20 μl samples were
taken immediately from each of the 0,5 g sections
and added to 100 μl of zinc acetate and made up to 5
ml with ddd H
2
O. The assay was performed as follows:
the samples were vortexed briefly and 500 μl of ferric
chloride solution (8 g FeCl
3
in 500 ml 6 M HCL) and
500 μl amide-sulphuric acid solution (2g N-N dimethyl-
p-phenylene diamine dihydrochloride in 500 ml
6 M H
2
SO
4
) were added. The samples were allowed to
stand at room temperature for 1 h and then the ab-
sorbance was read on a Shimadzu UV-160A UV-visible
recording spectrophotometer at 670 nm.
For sulphur analysis 200 μl of each 0,5 g sample
was placed in an Eppendorf tube and microfuged
at 13 000 r/min for 10 min. The supernatant was
discarded and the pellet re-suspended in 100 μl of
high performance liquid chromatography (HPLC) grade
acetone. The sample was allowed to stand for 1 h
and then filtered through a 0,45 μm nylon membrane
to remove any particulate matter. The samples were
analysed by HPLC using a Phenomenex LUNA 5μ C18
(2) size 150 x 4,6 mm column, mobile phase 95:5
methanol:water, run at a flow rate of 2 ml/min and
using a Waters 484 Absorbance Detector.
Sulphate analysis was performed by HPLC. Sam-
ples were diluted 1 in 10 and then 1 ml of this sample
was filtered through a 0,45 μm nylon filter followed
by a Waters C18 solid-phase extraction cartridge. A
Hamilton PRP-X100 10 μm 150 x 4,1 mm column with
a para-hydroxybenzoic acid/methanol (5,52 g:250 ml)
mobile phase was used at a flow rate of 2 ml/min with
a Waters 430 conductivity detector.
For total organic carbon (TOC) analysis, a Rose-
mount Dohrmann Total Organic Carbon Analyzer DC-
180 was used. All reagents were supplied by Merck.
Results and discussion
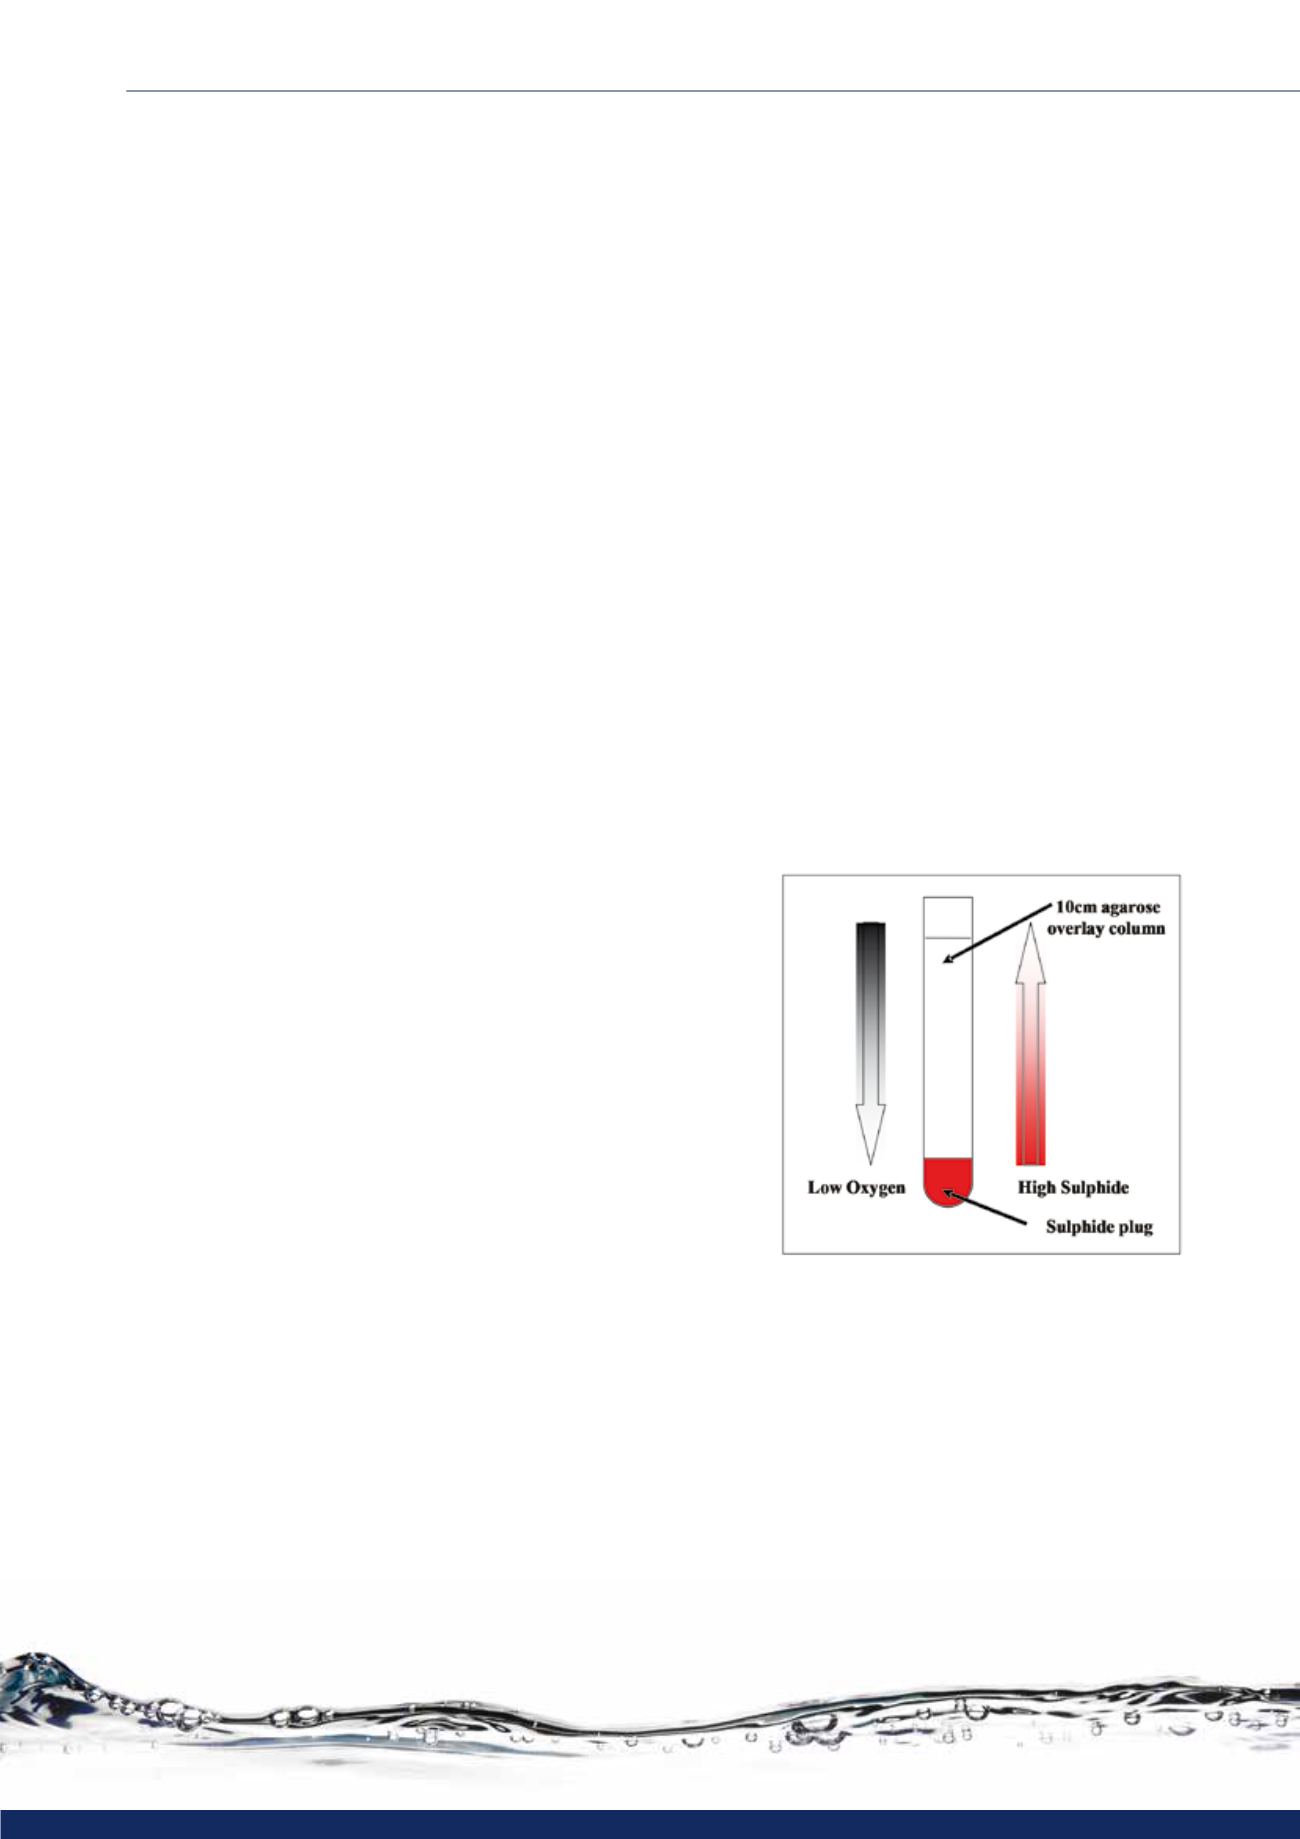
Figure 3 illustrates the principle of the gradient tube
method whereby apposing gradients, in reducing
concentrations, are established, and where sulphide
migrates from the bottom plug upwards and oxygen
migrates from the top of the tube downwards. This is
designed to replicate conditions at the oxic/anoxic
interface of the water surface in the sulphidic aquatic
environments being investigated, where oxygen mi-
grating from the air into the water column meets the
underlying sulphide layer. It is in the presence of this
type of gradient that the appearance of the floating
sulphur biofilm structures is observed. In the tube
method, gradients of high sulphide/low oxygen and
low sulphide/high oxygen are established over a 10
cm length of the agarose plug; this provides a range
of niches for the growth of any physiologically distinct
microbial populations that are present in the original
biofilm. These would possibly grow and be discernible
as separate zones of population dominance within the
tube, which has now been expanded across the 10 cm
length of the agarose column, rather than the 50 μm
to 500 μm of the original biofilm.
Figure 3: Diagram showing the setup of the gradient tubes
with a plug of sulphide in the base and overlaid with agarose in
which a composite sample of biofilm had been suspended. The
opposing gradients of oxygen and sulphide that are set up in
this way are shown.
The results detailed in Figure 4 report analyses for
sulphide, sulphur, sulphate and TOC for the 5 mm aga-
rose column cut sections, and compare various biofilm
inoculated samples with uninoculated controls. These
results are plotted as depth profiles on the y-axis and
report the results within the agarose column from the
bottom of the tube upwards, which occurs against
a background of increasing oxygen and decreasing
sulphide concentrations.
water treatment


