materials of construction
Figure 3: Repeatability of 27wt%VC in 1 M NaCl
Corrosion parameters
Table 3 presents the corrosion parameters of the
specimens in NaCl and SMW. Vanadium carbide ad-
ditions of 0,4wt%VC, levels used for grain refinement,
simultaneously made the E
corr
more negative, and the
corrosion current density higher than that of specimen
0VC in both electrolytes. A similar trend was obtained
in acidic solutions. Higher VC contents made E
corr
nobler in NaCl compared to specimen 0VC. However,
the corrosion current density increased and appeared
to be independent of the VC content, an observation
that was different from that found for HCl and H
2
SO
4
acidic solutions where current density decreased with
increasing VC content.
There was no observable trend of the effect of
increasing VC content on E
corr
in SMW: 10wt%VC
increased E
corr
to a more noble value, while 27wt%VC
decreased it to a lesser noble value, compared to
specimen 0VC. However, the corrosion current densi-
ties decreased to values lower than those of specimen
0VC, the decrease tempered by the cobalt content.
Table 3: Electrochemical parameters of the WC-VC-Co samples
in NaCl and SMW
NaCl
SMW
E
corr
(V)
(v SSE)
i
corr
(µA/cm
2
)
E
corr
(V) (v
SSE)
i
corr
(µA/cm
2
)
WC-10Co -0.399 0.03
-0.313
0.18
WC-0.4VC
-10Co
-0.469 0.20
-0.474
0.21
WC-10VC
-12Co
-0.370 0.36
-0.296
0.15
WC-27VC
-11Co
-0.361 0.28
-0.379 0. 08
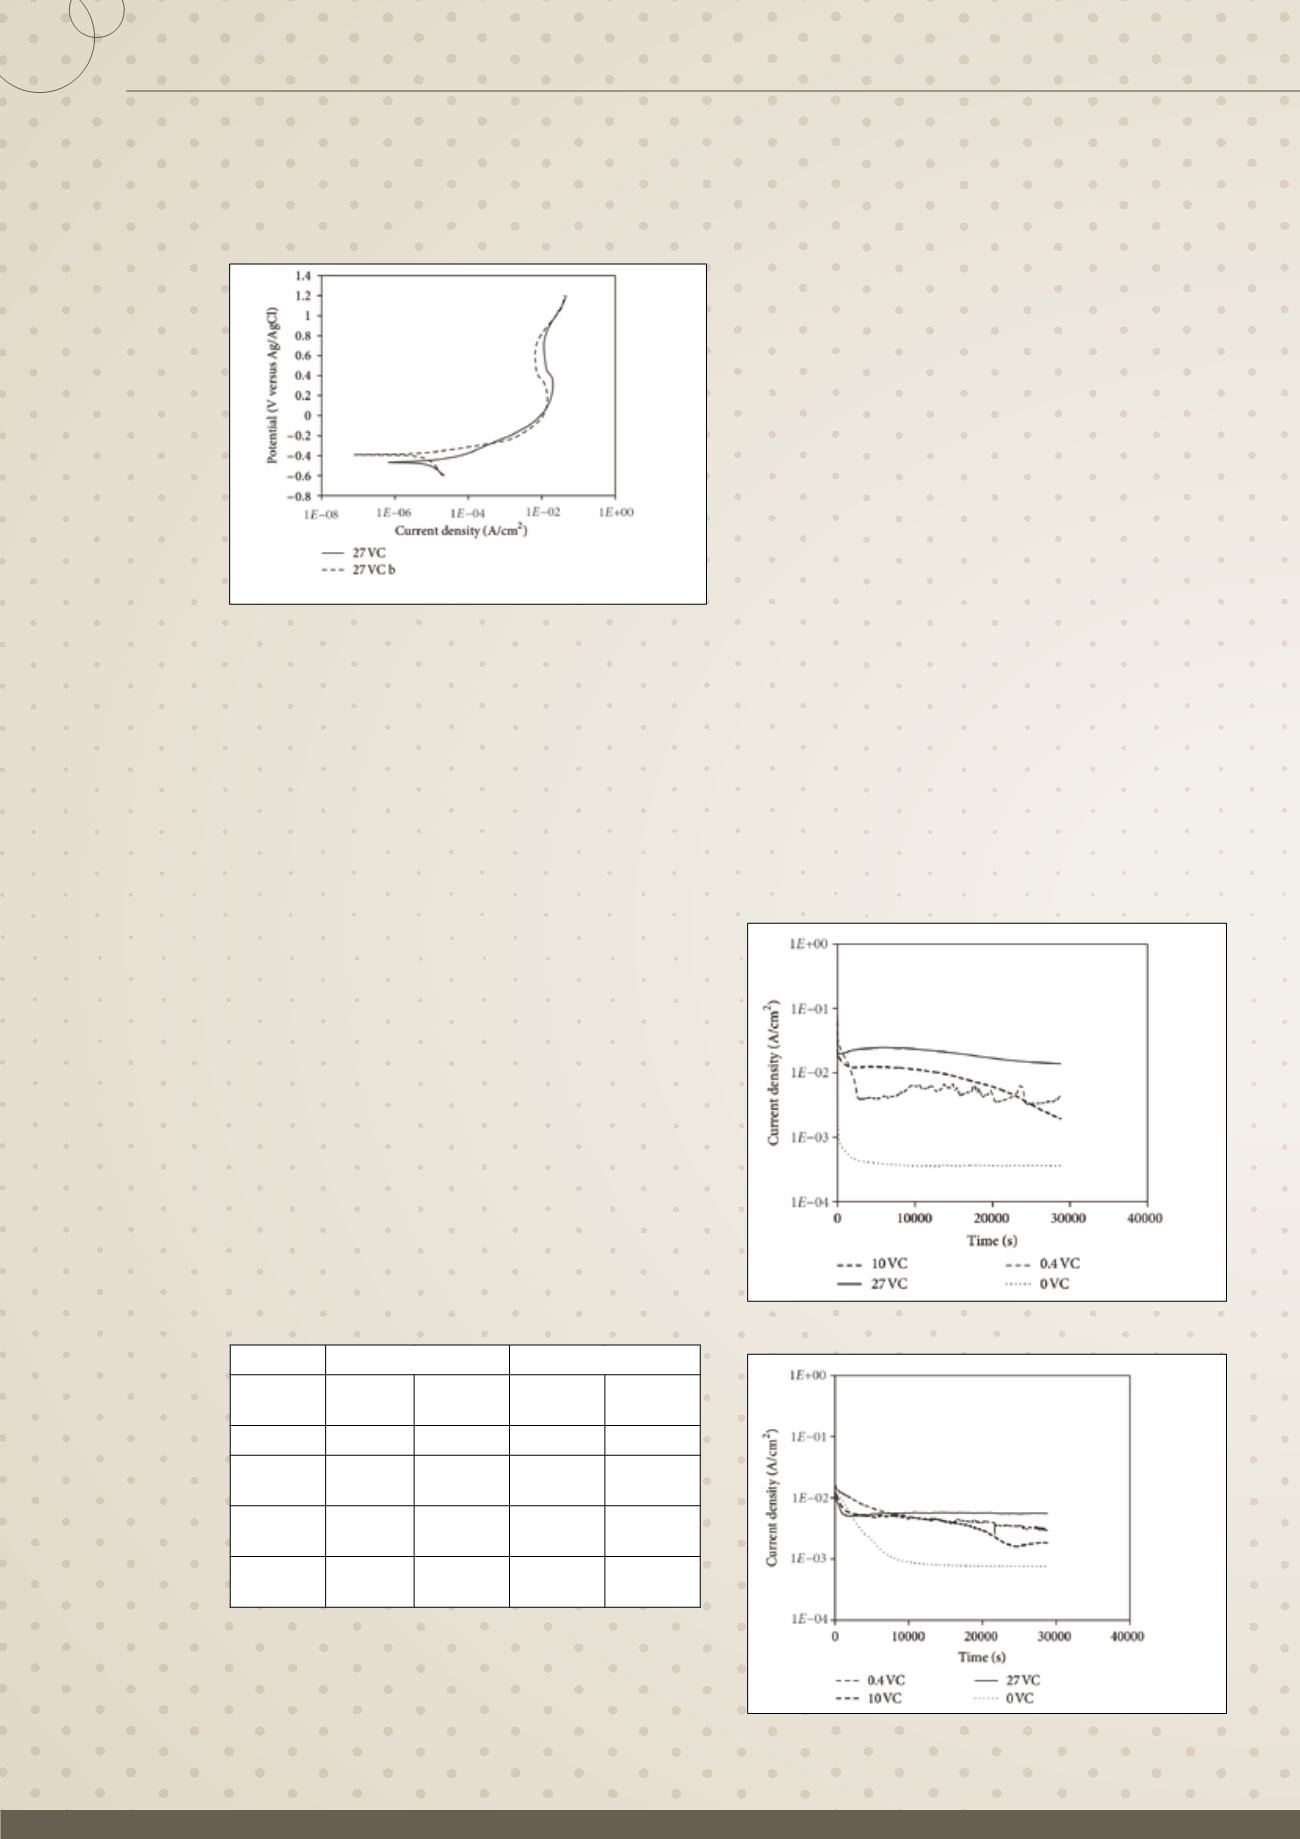
Chronoamperometry studies
Chronoamperometric tests were done at 0,8V (v SSE)
for specimen 0VC and 0.7V (v SSE) for the WC-VC-Co
hardmetals in 1 M NaCl based on pseudopassivation
at these potentials. Due to the continuous dissolu-
tion of all the samples during anodic polarization
in SMW, a potential of 1,1V (v SSE) was used for all
the samples. Figure 4 shows the variation of current
for tests in the NaCl solution. Specimen 0VC passiv-
ated instantaneously and had the least steady state
current density, unlike the VC specimens. The lowest
VC addition (0,4wt%VC) produced fluctuations in the
current density curve, implying some pitting corrosion.
The current for the high VC content alloys decreased
quickly and then increased before decreasing again.
Decreasing current densities are associated with a
build-up of corrosion products on the test surface
while increases suggest oxidation events that are
caused by the fracture and/or fall off of the corrosion
product that had formed on the surface to expose the
underlying surface.
There was no instantaneous passivation of any
specimen in SMW (Figure 5). In addition to the 0VC
specimen, 27VC also attained a steady state current
density. As was the case in NaCl (Figure 4), the speci-
men 0VC had the least steady state current. Current
fluctuations were observed for specimen 0,4VC, an
indication of pitting, but the fluctuations we
re less pronounced than in NaCl (Figure 4).
Figure 4: Chronoamperometry curves of the samples in NaCl
Figure 5: Chronoamperometry curves of samples in SMW
30
Chemical Technology • September 2013


