materials of construction
31
Chemical Technology • September 2013
Surface phases after corrosion
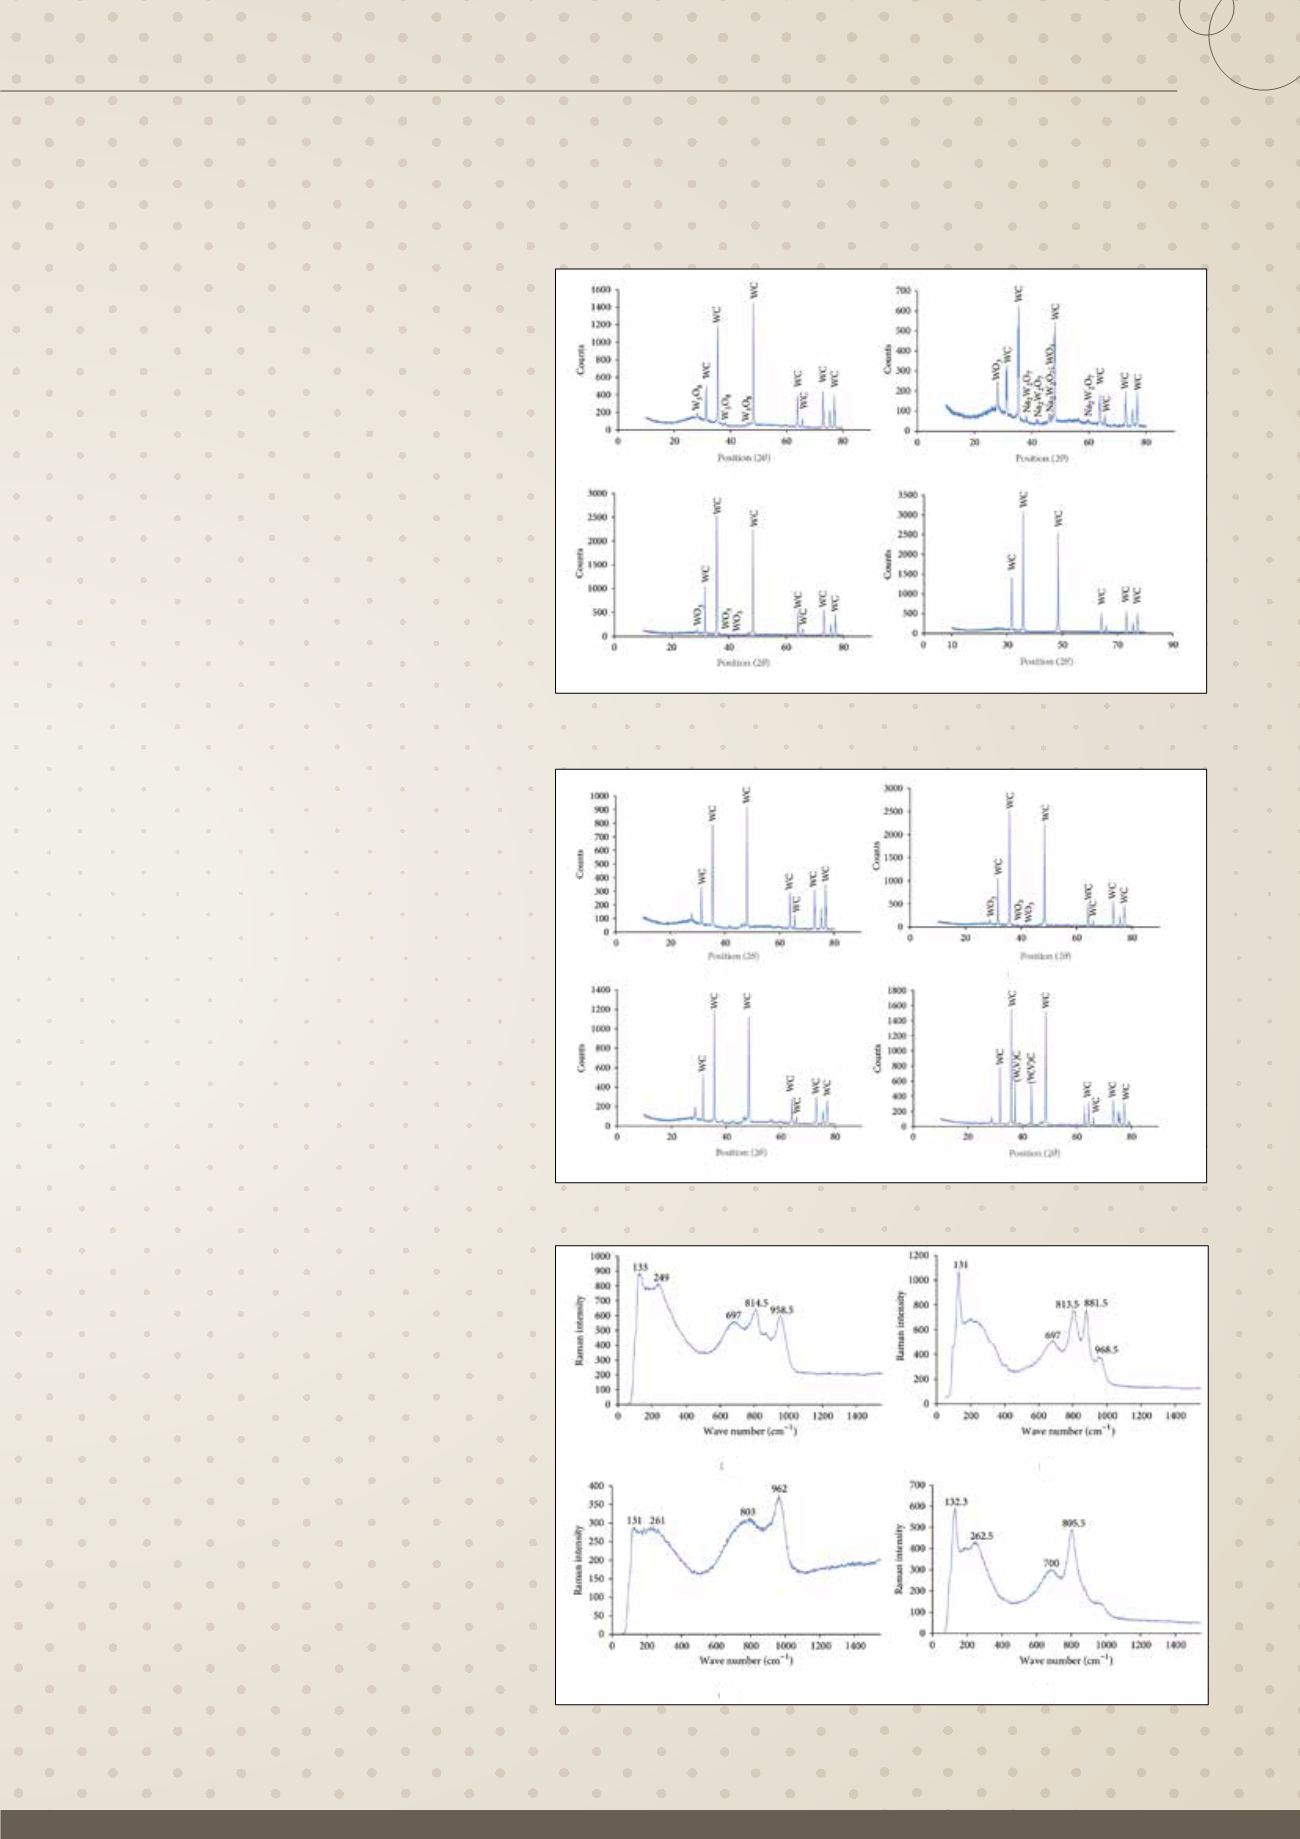
Figures 6 and 7 are XRD patterns of specimen
surface phases after chronoamperometric test-
ing in NaCl, and SMW, respectively. The XRD pat-
terns of the samples before corrosion have been
published elsewhere. The absence of Co peaks
in Figures 6 and 7 indicate there was no Co in the
surfaces after corrosion, and confirm a literature
observation that the Co in WC-Co-based hardmet-
als corrodes preferentially. Raman spectroscopy
indicated that tungsten oxides formed for some
specimens (Figures 8 and 9). In contrast, there
were no XRD peaks for vanadium-based corro-
sion phases on the surfaces of the VC-containing
specimens after corrosion in any of the test elec-
trolyte (Figures 6 and 7).
The XRD patterns of some VC-containing
specimens did not have XRD peaks for VC (which
occurs as (V,W)C) after corrosion (10VC and
27VC) specimens in NaCl and 10VC in SMW as
presented earlier. These peaks were present
after corrosion in acid solutions, where corro-
sion rates were at least an order of magnitude
higher. It is possible that in the current case, the
(V,W)C grains fell out during specimen handling
due to the dissolution of the binder, as has been
observed in literature.
Raman spectroscopy (Figures 8 and 9), which
is more sensitive than XRD analysis, showed that
the corrosion products for all test specimens were
tungsten-oxide based, even though they had not
been detected by XRD analysis in some cases, es-
pecially in SMW (Figure 7). Tables 4 and 5 allocate
the Raman bands to their possible sources based
on observations in literature. In the literature,
Raman bands below 190 cm
-1
are associated
with lattice vibration of crystalline WO
3
; bands
between 190 and 400 cm
-1
are due to bending
of O-W-O bonds; those in the range 500 – 900
cm
-1
are characteristic of stretching O-W-O bonds;
and bands in the vicinity of 950, characteristic
of hydrated WO
3
, are caused by the stretching of
terminal W=O bonds.
No Raman band matches were found for pos-
sible vanadium-based corrosion products, eg,
vanadium oxide, vanadium oxy-chloride (VOCl
3
),
whose Raman bands are available in literature.
However, during the chronoamperometric tests,
light green solids were observed to form in the
solutions. Inductive coupled plasma optical
emitting spectrometry (ICP-OES) analysis of the
electrolytes indicated the presence of vanadium
cations probably V(II) (Table 6) indicating that
the green solids that formed were probably VCl
2
,
which is known to be green.
Figure 6: XRD pattern of the corrosion products of the samples on a) WC-
10Co, b) WC-0.4VC-10Co, c) WC-10VC-12Co, and d) WC-27VC-11Co in NaCl.
Figure 7: XRD pattern of the corrosion products of the samples on a) WC-
10Co, b) WC-0.4VC-10Co, c) WC-10VC-12Co, and d) WC-27VC-11Co in SMW.
Figure 8: Raman spectra of corroded product on a) WC-10Co, b) WC-0.4VC-
10Co, c) WC-10VC-12Co, and d) WC-27VC-11Co in NaCl.
(a)
(b)
(c)
(d)
(a)
(b)
(c)
(d)
(a)
(b)
(c)
(d)


