29
Chemical Technology • September 2013
materials of construction
Electrochemical measurements
Electrochemical measurements were carried out using
a three electrode cell consisting of the test specimen
as the working electrode, a graphite rod counter elec-
trode (CE) and a silver/silver chloride electrode (SSE)
(in saturated KCl) reference electrode against which
all potentials were reported. The reference electrode
was connected to the test cell via a Luggin probe
capillary. All tests were done at room temperature and
the electrolytes were neither de-aerated nor aerated
during testing.
The electrolytes used were 1 M sodium chloride
(NaCl) and synthetic mine water (SMW) whose com-
position is given in Table 2. They represent the mining
environment where WC-Co is used to combat wear. The
composition of the SMW used is the most aggressive
mine water found in the gold mines of South Africa.
Table 2: Synthetic mine water composition
Compound
Concentration (mg/l)
Na
2
SO
4
1237
CaCl
2
1038
MgSO
4
199
NaCl
1380
Test samples were polished to a 1µm surface finish
after being made electrically conductive by attaching
an aluminum sticker tape to one face in a cold mount-
ed mould. After immersion in the electrolytes, the
open circuit potential (OCP) was allowed to stabilize for
two hours. Potentiodynamic anodic polarization mea-
surements were done using an Autolabpotentiostat/
galvanostat connected to a personal computer with
a General Purpose Electrochemical System (GPES)
software. Potential was varied from -600 mV to +
1 200 mV at a scan rate of 2 mV/s for all the samples,
a rate commonly used in other studies. The corrosion
potential (E
corr
), corrosion current density (i
corr
) and cor-
rosion rates were retrieved from the corrosion mea-
surement data using the intersection of the anodic
and cathodic Tafel lines.
Chronoamperometry measurements were per-
formed immediately at the end of potential sweeps.
They were done for eight hours at potentials selected
from the anodic polarization curves and were de-
signed to investigate the corrosion products on the
surfaces of the specimens.
Samples were characterised for phases before
and after corrosion testing using a Phillips PW 1710
X-ray diffractometer. Surfaces of specimens after
chronoamperometric tests were analyzed using a Ra-
man spectrometer (Senterra, Bruker Optics) coupled
with a Peltier cooled CCD detector (576×288 pixels)
equipped with a 532 nm wavelength laser. The vana-
dium content of the test electrolytes after chronoam-
perometric testing was determined using a Spectro®
Genesis inductively coupled plasma (ICP)– optical
emitting spectrometer (OES).
Results
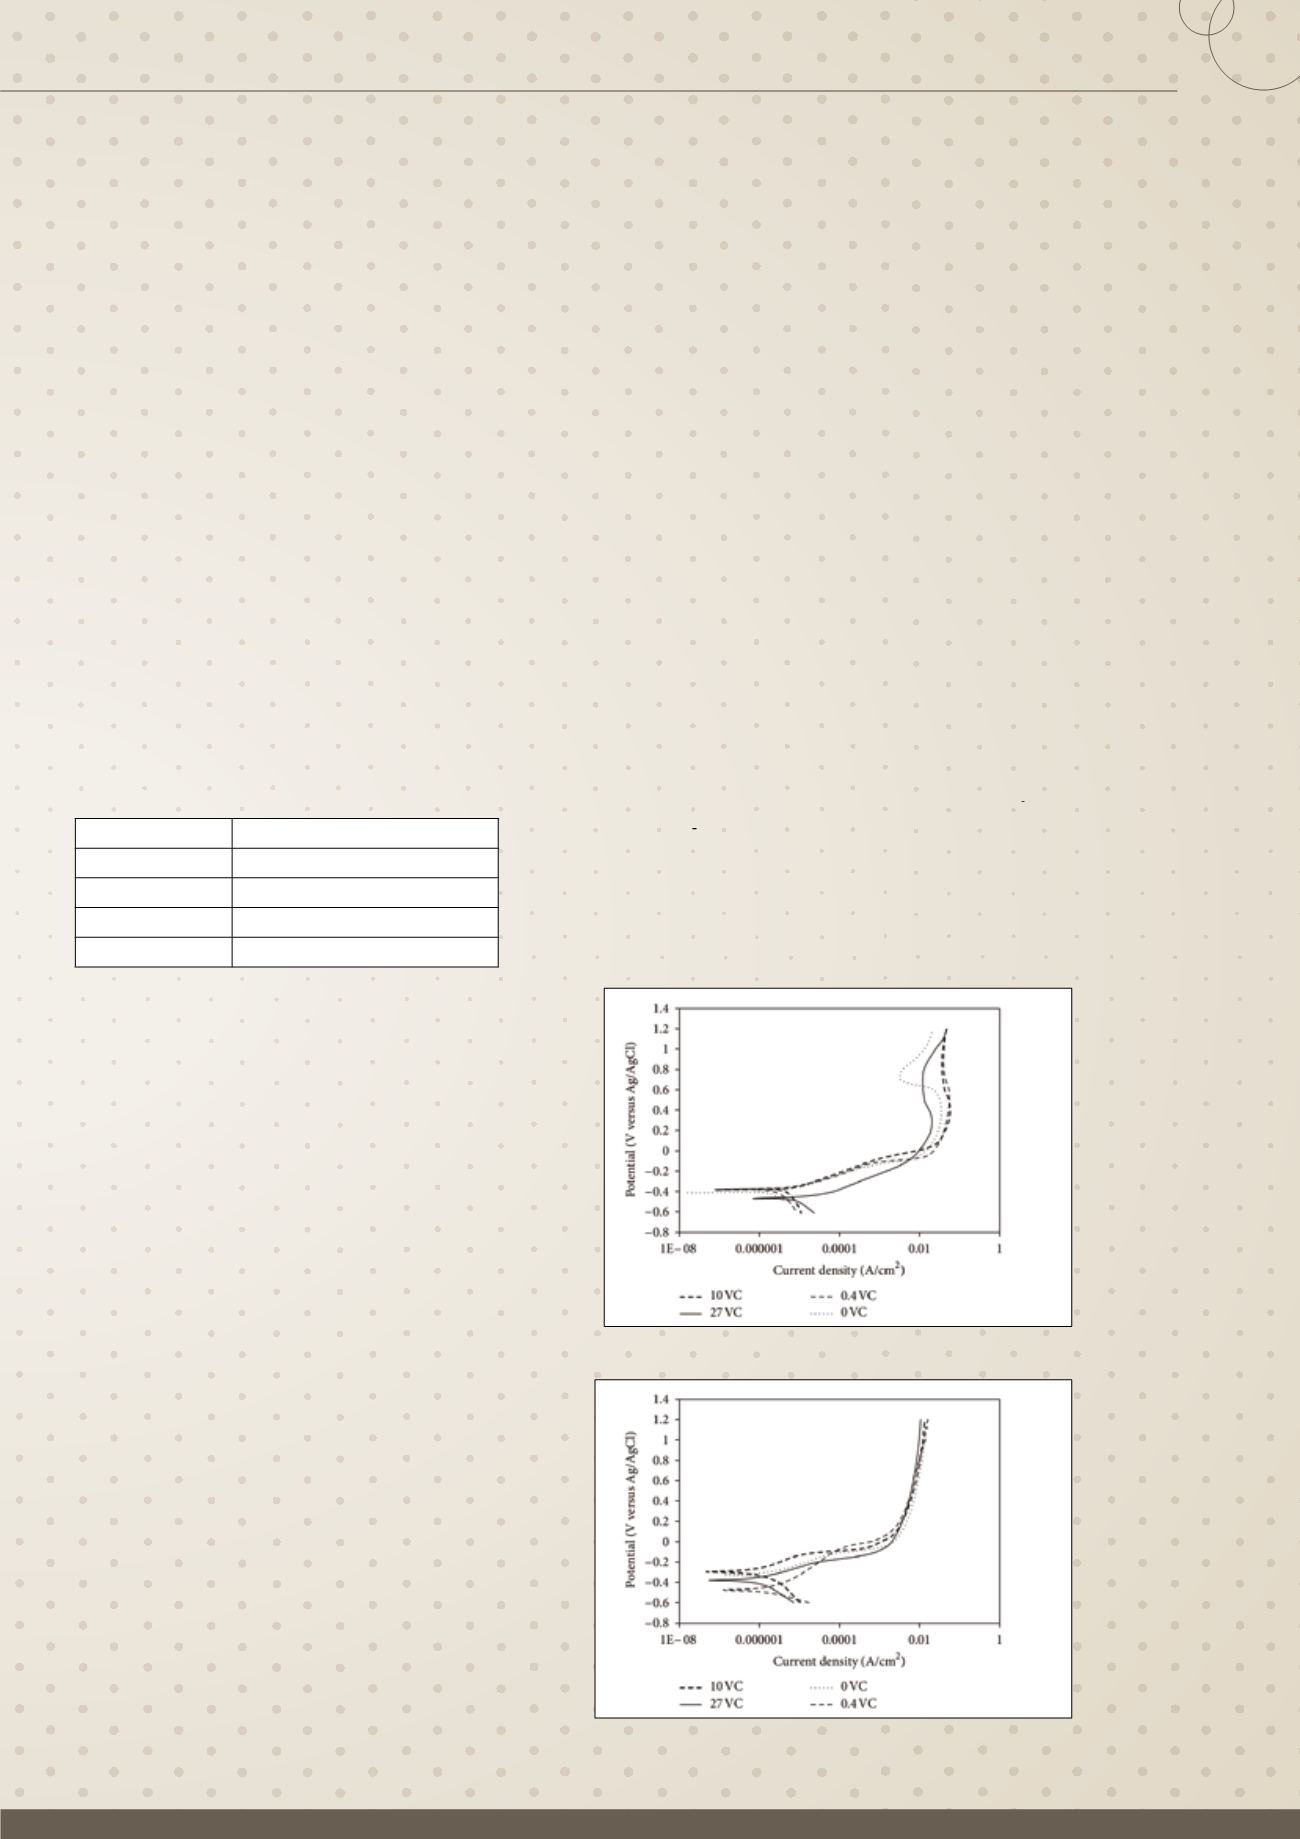
Potentiodynamic polarization behaviour
Figures 1 and 2 show the potentiodynamic polariza-
tion curves of the samples in 1 M NaCl and SMW
respectively while Figure 3 shows that the anodic
polarization behaviour for each specimen was repeat-
able. The pseudopassive anodic polarization behav-
iour of all the samples in NaCl was similar to that ob-
served in HCl acid solutions. This behaviour was more
pronounced for the specimen with the least mag-
netic saturation (WC-10Co in Table 1). In literature,
WC-10Co specimens do not exhibit pseudopassive
behaviour when dilute (0,1M)NaCl solutions are used.
The high Cl
anion concentration used in this study
compared to literature favours passivation. Compared
to NaCl, anodic dissolution occurred continuously, for
all specimens during potentiodynamic polarization in
SMW (Figure 2). The behaviour of the specimen WC-Co
agreed with literature.
Figure 1: Potentiodynamic curves of the samples in NaCl
Figure 2: Potentiodynamic curves of the samples in SMW


