23
Chemical Technology • September 2013
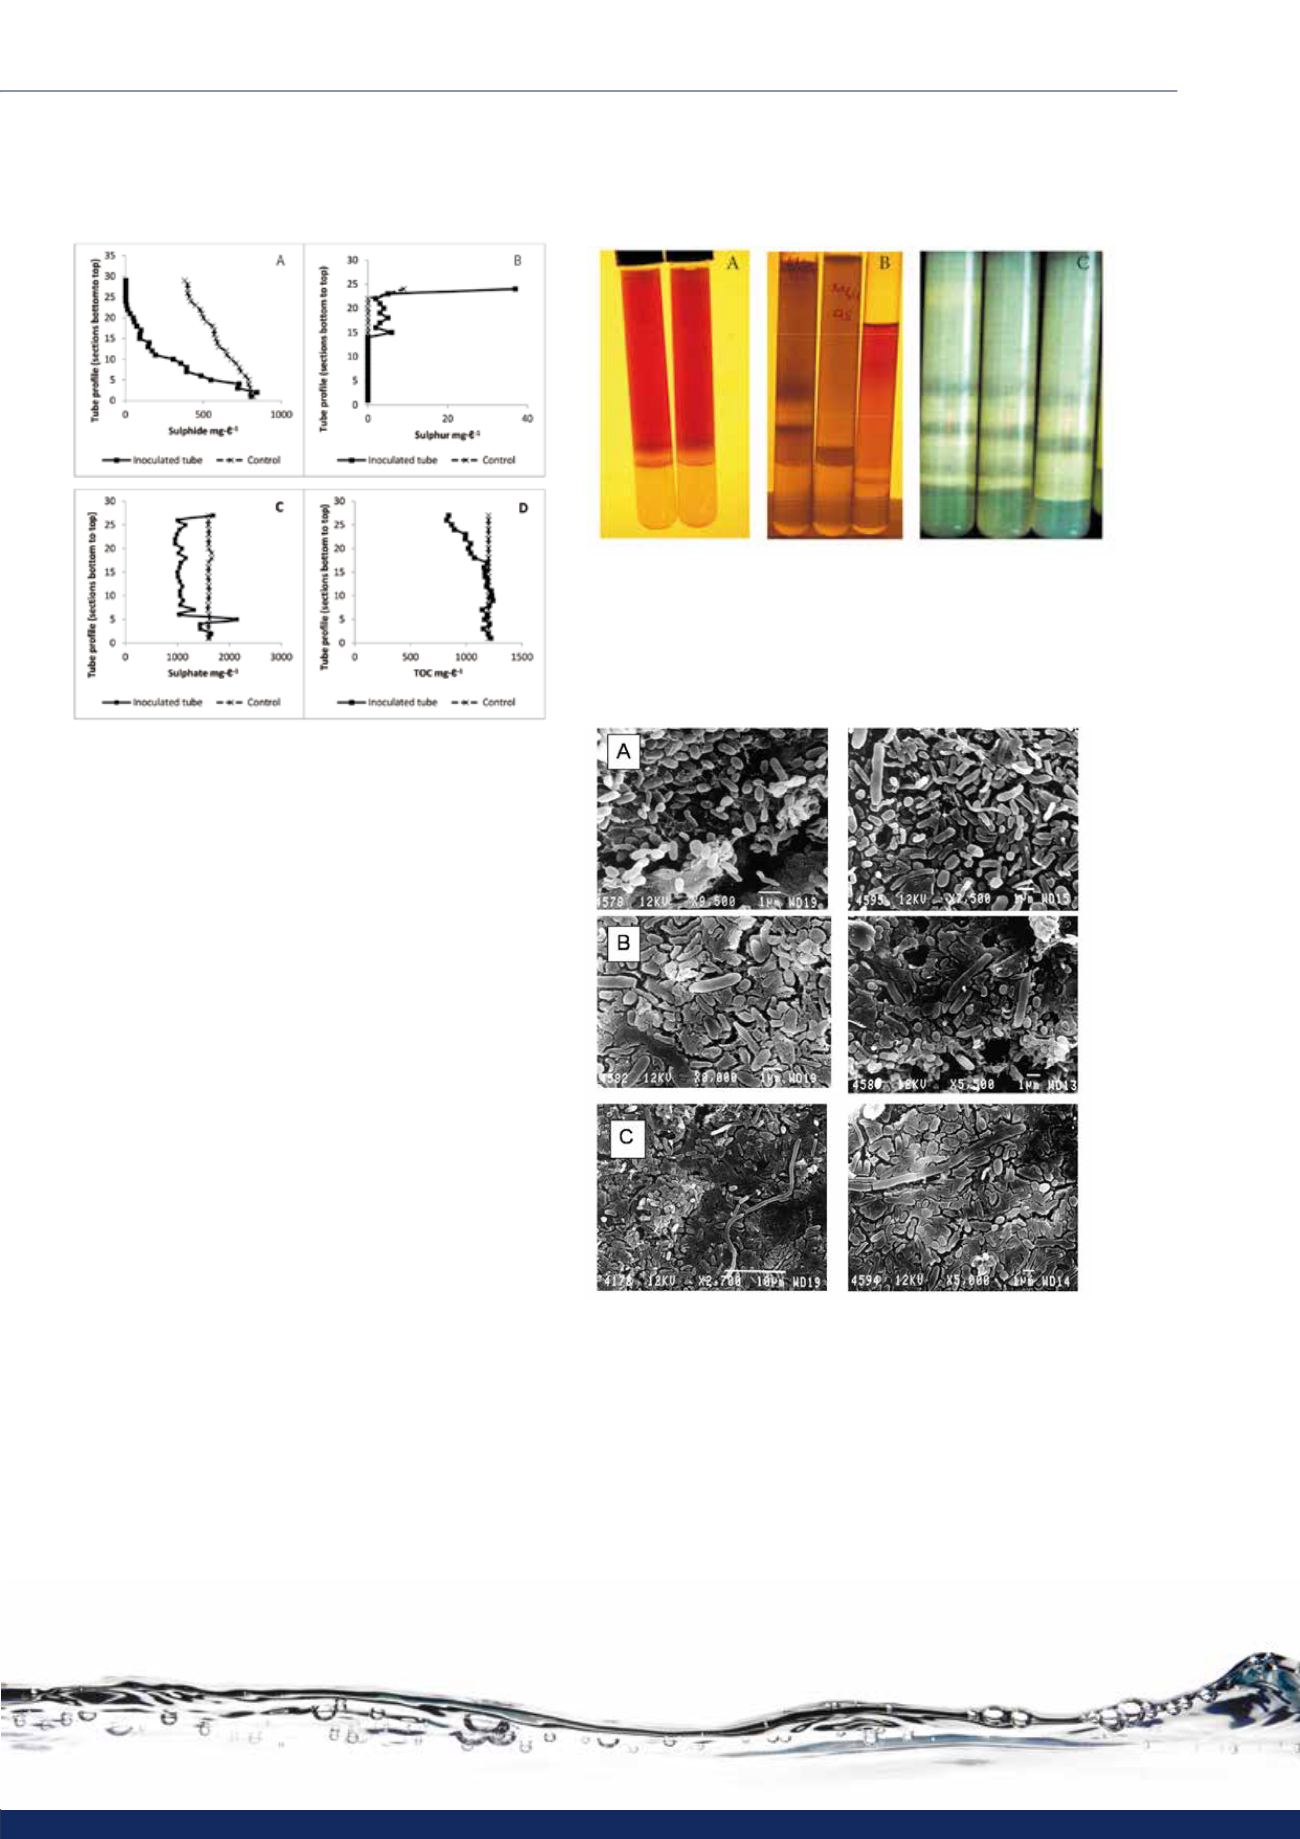
Figure 4:
A. Sulphide concentration profile through the depth of the gradi-
ent tube as measured in each of the 5 mm agarose cut sections.
An inoculated tube is compared with the uninoculated control.
B. Sulphur concentration profile through the depth of the gradi-
ent tube as measured in each of the 5 mm agarose cut sections.
An inoculated tube is compared with the uninoculated control.
C. Sulphate concentration profile through the depth of the gradi-
ent tube as measured in each of the 5 mm agarose cut sections.
An inoculated tube is compared with the uninoculated control.
D. Total organic carbon concentration profile through the depth
of the gradient tube as measured in each of the 5 mm agarose
cut sections. An inoculated tube is compared with the uninocu-
lated control.
Comparison of controls against experimental re-
sults reported in Figure 4 shows that a sulphide gradi-
ent is established along the length of the agarose col-
umn as anticipated. In the biofilm-inoculated sample,
sulphide removal was found to be active across about
80% of the column length.
Figures 4B and 4C report the sulphur and sulphate
concentration profiles, respectively. These results indi-
cate the presence of incomplete oxidation of sulphide
with a predominant conversion to sulphur, rather
than complete oxidation to sulphate. These findings
indicate a careful poising of the redox environment
(Rein 2002) which, if unregulated in some way, would
expect to show the complete oxidation of sulphide
in the upper oxic zones of the tubes. If a metabolic
energy input is required to maintain the redox pois-
ing of the system, some TOC would be expected to be
consumed in the process, and this is what was found
in Figure 4D, where up to 30% of TOC was removed in
the upper layer of the tubes.
Figure 5: Photographs of uninoculated gradient tube controls
(A) and inoculated tubes (B) showing the appearance of visible
bands and a change in colour of the neutral red indicator after
24 h incubation. The sulphide plug may be seen in the base of
the tube. Photograph of inoculated tubes after incubation for 7
days showing white bands of sulphur forming at different levels
within the gradient tubes (C).
Figure 6: Scanning electron micrograph of inoculated agarose
samples from the top (A), middle (B) and bottom (C) sections
of separate gradient tubes. The presence of different microbial
morphological types occurring at different levels is apparent,
with coccoid forms predominating in the upper layers, rods in
the middle layers and filamentous forms appearing also in the
bottom layers.
Figures 5B and 5C show the appearance of sulphur
bands in the tubes after 1 day and 7 days of growth,
respectively. Figure 6 shows scanning electron micro-
graphs of samples from the top, middle and bottom of
the gradient tubes and indicates differentiation of the
microbial populations within separate bands. The up-
water treatment


