Mechanical Technology — August 2013
11
⎪
Proactive maintenance, lubrication and contamination management
⎪
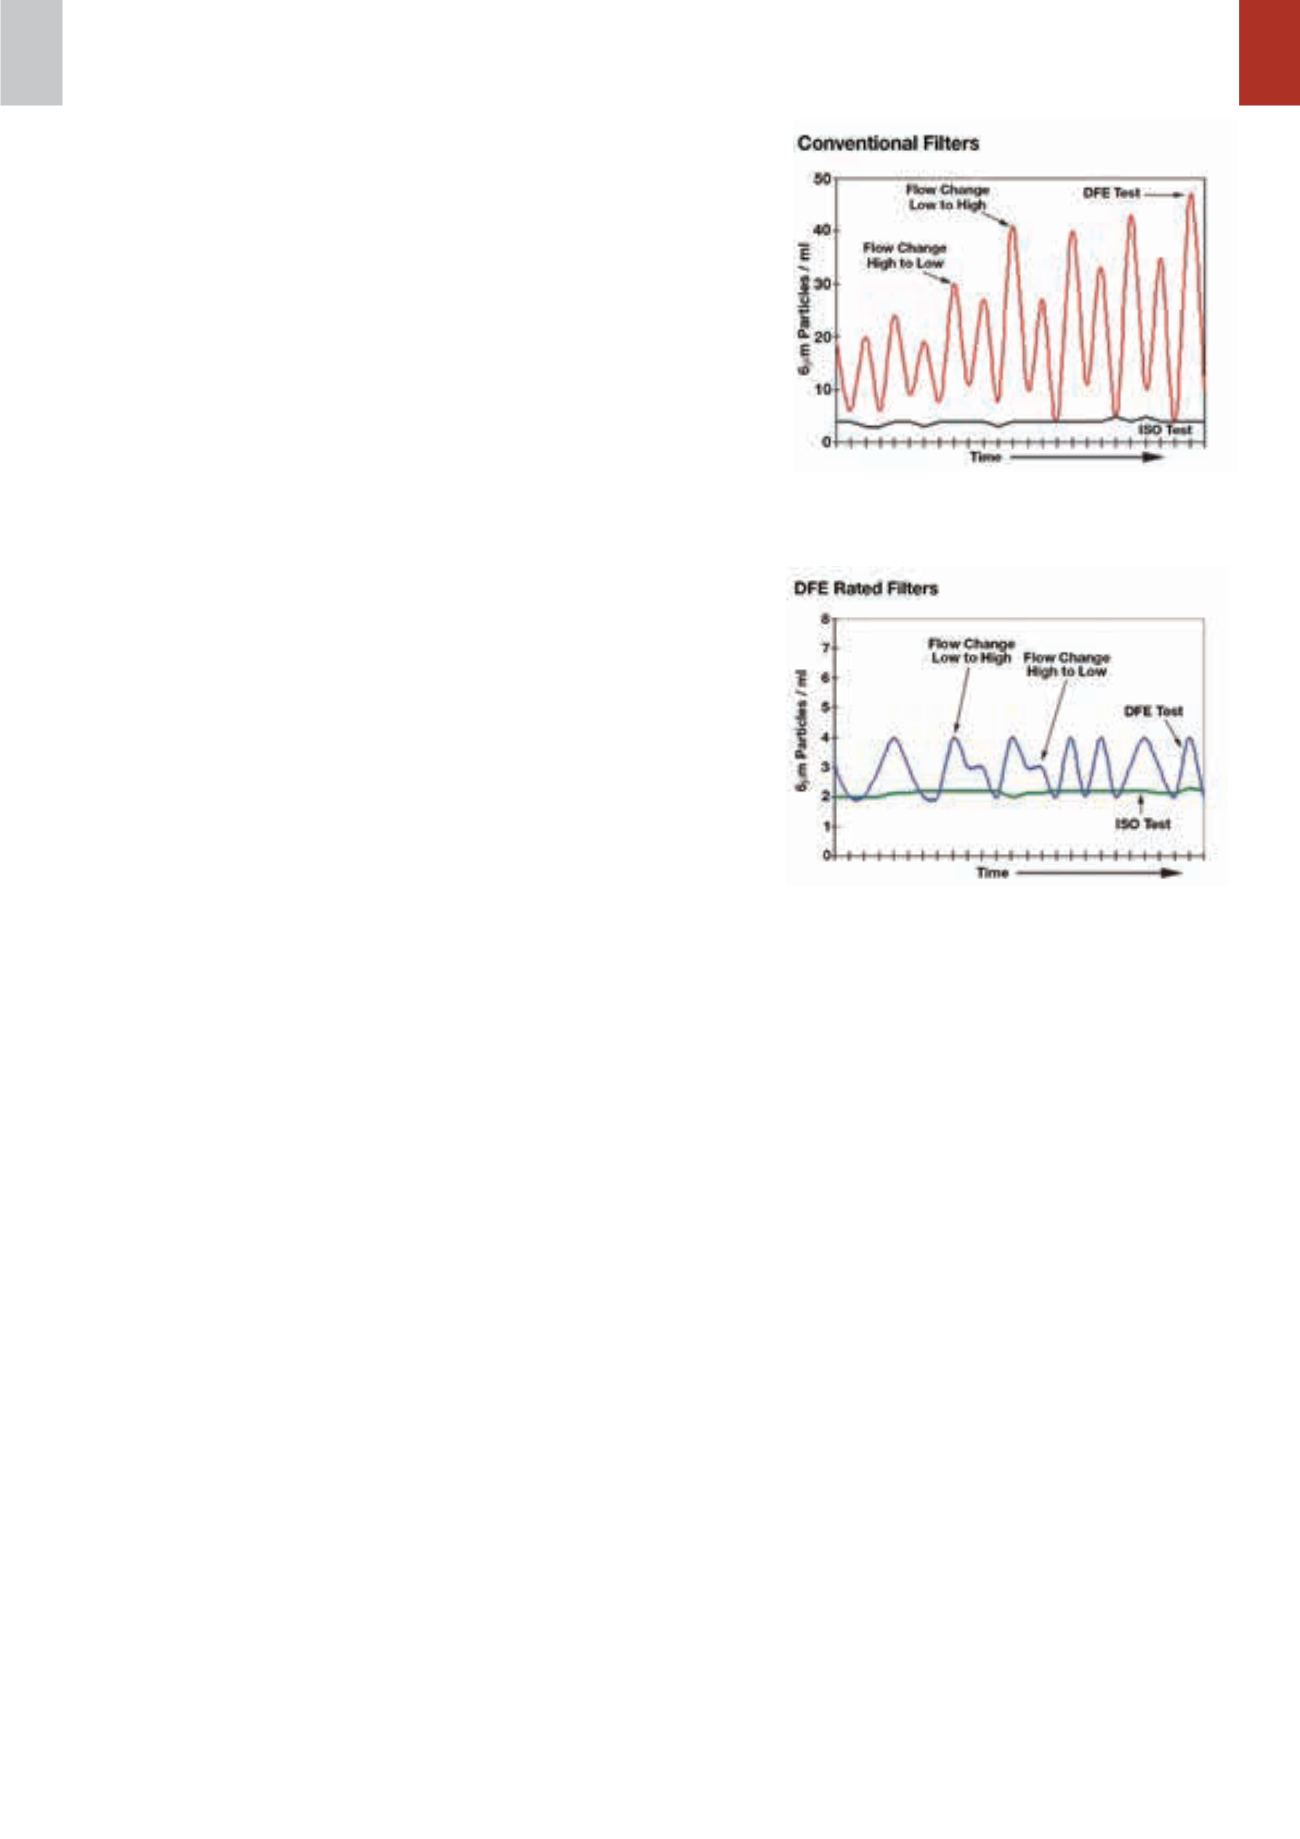
Figure 2: The performance of identical high-
efficiency, glass-media filter elements, rated
at
β
7
(c)
> 1 000, tested using ISO and DFE
methods.
Figure 3: The performance of identical DFE-rated
Hy-Pro filters tested using both ISO and DFE
methods.
The DFE multi-pass testing
method
The dynamic filter efficiency (DFE)
multi-pass test circuit also uses up-
stream and downstream particle coun-
ters, a test filter, and contaminant injec-
tion upstream of the test filter, much
like ISO 16889. But that is where the
similarity ends.
In contrast, the DFE test introduces a
range of duty cycles throughout the test,
bridging the gap between the laboratory
and the real world. The DFE flow rate
is not constant but, rather, hydrostati-
cally controlled so full flow through the
test filter can quickly be changed to
simulate various hydraulic duty cycles.
Flow across particle-counter sensors
remains constant during all readings
and no intermediate reservoirs col-
lect fluid prior to measurements. This
ensures that the fluid contamination
count accurately represents real-time
system contamination levels. Counts
are made before, during, and after each
flow change, with results reported as a
filtration ratio or beta efficiency based
on the ratio of the actual number of
particles per millilitre of fluid upstream
and downstream of the filter.
DFE testing quantifies both capture
and retention efficiency in real time,
whereas ISO 16889 looks at nor-
malised numbers over a time-weighted
average. DFE testing provides an inside
look at the vital signs of a filter through
a range of dynamic conditions to bet-
ter understand how well a filter will
capture and retain contaminants, and
in real time.
Raw data is digitally tagged so
filter efficiency is gauged for various
combinations of flow conditions and
differential pressures across the filter
element. Typical particle counts are
taken at maximum and minimum flows,
and when flow changes (low to high or
high to low). Rapid particle counting
with proper timing provides a real-time
understanding of the capture efficiency
and retention characteristics of a filter.
Quantifying DFE test results
A test performed at Hy-Pro examined
the performance of two identical high-
efficiency, glass-media filter elements,
rated at
β
7
(c)
> 1 000, tested using
ISO and DFE methods, respectively.
The results are summarised in Figure 2.
At a constant 112
ℓ
pm flow (ISO
test) and a contaminant injection rate
of 3,0 mg/
ℓ
, the first tested filter main-
tained steady efficiency. But when flow
was cycled through the second filter at
between 56 and 112
ℓ
pm (DFE test),
particle counts after the filter varied
significantly and were highest during
changes from low to high flow.
The peaks shown in Figure 2 repre-
sent counts taken during flow changes
and the valleys represent counts taken
after flow stabilised. As the filter cap-
tured more contaminants, downstream
counts increased, most dramatically
during changes from low to high flow.
This is best described as ‘contami-
nant unloading’. As the filter element
captures more dirt, greater amounts
can be released back into the system,
particularly when the element experi-
ences dynamic flow conditions and
changes in differential pressure. The
alternating smaller peaks represent
unloading when flow rate changes from
high to low. Highly concentrated clouds
of contaminated fluid released during
unloading can cause severe component
damage and unreliable system perfor-
mance, especially if the filter’s role is to
protect sensitive components.
From this, we can surmise that this
filter element is not properly designed to
retain previously captured contaminants
during dynamic system conditions. In
addition, excessive unloading early in a
filter’s life may be symptomatic of an el-
ement that will eventually break down,
lose its efficiency altogether, and fail.
It is not surprising that many ele-
ments get higher ratings when tested
according to ISO 16889 than they do
against DFE tests. This is troubling
because OEMs often select filter media
based on ISO beta ratios published by
filter manufacturers. A common result
is a hydraulic system that suffers from
premature contamination-related fail-
ures, even though it is protected by
filters that, in theory, should prevent
such failures. This can lead to exces-
sive downtime, unreliable equipment
performance, and expensive component
repair and replacement costs.
DFE-rated filters, which are built to
withstand changes in flow rates, still
exhibit differing performance under ISO
and DFE tests, as shown in Figure 3,
which shows the results of two identical
Hy-Pro filters, designed and developed
to suit dynamic conditions. Although
contaminant unloading is still evident,
it is insignificant as the filter element
performed true to its ISO 16889 multi-
pass rating of
β
7
(c)
> 1000, even during
dynamic flow conditions.
Cold start contaminant
retention
DFE’s ability to simulate cold start
conditions is also critical. Once an ele-
ment is nearly filled to its contaminant-
holding capacity (about 90% of terminal
∆
P rating across the filter), the main
flow and injection systems are shut off
for a short dwell period. Then, the main
pump restarts and rapidly attains maxi-
mum rated flow for the filter element
under test. Simultaneously, a real-time
particle count measures retention ef-
ficiency of the contaminant-loaded ele-
ment. This quantifies how well the filter
element retains previously captured
contaminant at start-up. The dwell
before restart may be based on time or
system temperature – to simulate cold
weather conditions.
Figure 4 and Figure 5 compare the
cold-start performance for conven-
tional and DFE-rated filters designed
according to the DFE restart test.
During restart, the number of 6,0
µ
m


